

Investigation 9.1. Scheduling a Soccer League.
Francine is the Program Director for the City Park Summer Program. This week she is planning the soccer league for seven-to-nine-year-olds. In this league, each team plays every other team once before the play-offs. The number of games Francine must schedule (not including the play-off games) depends on how many teams she allows in the league. To get a feel for the numbers involved, Francine does some calculations.
- How many games will be needed if there is only one team in the league? (This event is not very likely, but Francine is looking for a pattern, so she considers all possibilities.) How many games will be needed if there are two teams? Record your findings in the table.
-
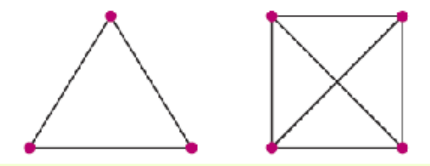
The number of games gets harder to calculate as the number of teams increases. Francine discovers that she can model the problem by drawing one dot for each team in the league, and then connecting each dot to every other dot with a straight line. The number of lines represents the number of games needed. The diagrams for three teams and for four teams are shown below. Use similar diagrams to fill in the table up to eight teams. (Be careful that no three of your dots "line up.")
Teams Games \(1\) \(\hphantom{0000}\) \(2\) \(\hphantom{0000}\) \(3\) \(\hphantom{0000}\) \(4\) \(\hphantom{0000}\) \(5\) \(\hphantom{0000}\) \(6\) \(\hphantom{0000}\) \(7\) \(\hphantom{0000}\) \(8\) \(\hphantom{0000}\) -
Plot the data points on a graph, using the number of teams (\(n\)) on the horizontal axis, and the number of games (\(G\)) on the vertical axis. For this problem, we cannot really connect the points because \(n\) cannot have fractional values. (Remember that \(n\) is the number of teams.) However, we will draw a faint curve through the points anyway to help us see a pattern. Do the points lie on a straight line?

-
Can you see a quick way to obtain more entries in the table? Here is a hint: Add another column to your table, as shown below. We will call this column \(\Delta G\text{,}\) which means "change in \(G\text{.}\)" As you move down the table, how much does \(G\) increase at each step? The first few values of\(\Delta G\) are filled in for you. Do you see a pattern? Use this pattern to fill in the table up to \(n=12\text{.}\)
\(n\) \(G\) \(\Delta G\) \(1\) \(0\) — \(2\) \(1\) \(1\) \(3\) \(3\) \(2\) \(4\) \(\hphantom{0000}\) \(\hphantom{0000}\) \(5\) \(\hphantom{0000}\) \(\hphantom{0000}\) \(6\) \(\hphantom{0000}\) \(\hphantom{0000}\) \(7\) \(\hphantom{0000}\) \(\hphantom{0000}\) \(8\) \(\hphantom{0000}\) \(\hphantom{0000}\) \(9\) \(\hphantom{0000}\) \(\hphantom{0000}\) \(10\) \(\hphantom{0000}\) \(\hphantom{0000}\) \(11\) \(\hphantom{0000}\) \(\hphantom{0000}\) \(12\) \(\hphantom{0000}\) \(\hphantom{0000}\) - Explain how you would compute the number of games needed for 21 teams if \(k\) games are needed for 20 teams.
- If \(G=f(n)\) represents the total number games needed for \(n\) teams, write an equation that shows how to compute \(f(n+1)\) in terms of \(f(n)\text{.}\)
- Summarize your work: In your own words, describe the relationship between the number of teams in the league and the number of games Francine must schedule. Include in your discussion a description of your graph.
