Chapter 10 Polar Coordinates and Complex Numbers
- \(\displaystyle \blert{\textbf{Polar Coordinates}}\)
- \(\displaystyle \blert{\textbf{Polar Graphs}}\)
- \(\displaystyle \blert{\textbf{Complex Numbers}}\)
- \(\displaystyle \blert{\textbf{Polar Form for Complex Numbers}}\)
The picture on the left below is a photo of a fern leaf. The picture on the right is a computer-generated image called the Barnsley fern. It is named after the British mathematician Michael Barnsley, who developed it in the 1980’s.
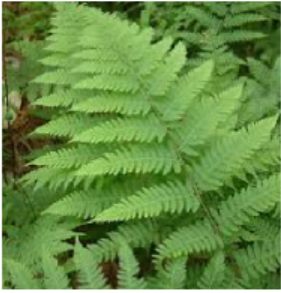

The Barnsley fern is an example of a fractal. A fractal is an infinitely complex pattern created by iteration: repeating a process over and over in an ongoing feedback loop. You can watch a Barnsley fern being created at
\begin{equation*}
\blert{\text{https://www.youtube.com/watch?v=iGMGVpLMtMs}}
\end{equation*}
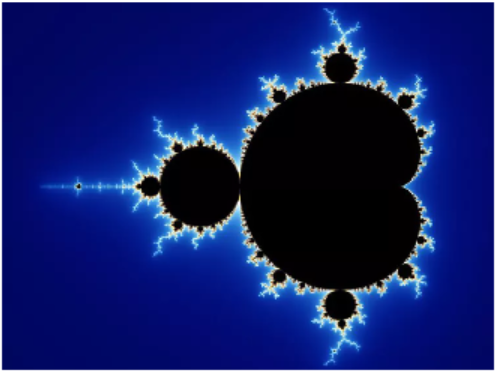
One of the most famous and intriguing fractals is the Mandelbrot set, named after the French mathematician Benoît Mandelbrot, who lived from 1924 to 2010. The Mandelbrot set looks like a cardioid, or heart-shaped figure, studded with circles all around its boundary.
Like the Barnsley fern, we can create the Mandelbrot set by repeatedly evaluating a simple equation over and over. This equation uses complex numbers.
The plane of complex numbers is similar to a two dimensional coordinate system. Every point on the plane is represented by a complex number \(c=x+iy\text{,}\) and we perform the following steps for every point:
Starting with \(z_1=0\text{,}\) we create an infinite sequence of complex numbers \(z_n\) according to the rule
\begin{equation*}
z_{n+1} = (z_n)^2 + c
\end{equation*}
If this sequence increases to infinity (it diverges), we color the point \(c\) white. If the sequence does not increase beyond a certain limit (it is bounded), we color the point black.
We create a sequence for every point \(c\) in the plane. The collection of all the black points is the Mandelbrot set. It sits in the portion of the plane where \(x\) is between \(-1\) and \(2\text{,}\) and \(y\) is between \(-1.5\) and \(1.5\text{.}\) Outside the set, all the values of \(c\) cause the sequence to go to infinity, and the color of the point is proportional to the speed at which the sequence diverges.
Because the calculations must be performed thousands or millions of times, we need computers to study them. The higher the number of iterations, the better the quality of the image produced. Not coincidentally, the Mandelbrot set was discovered in 1980, shortly after the invention of the personal computer.
One of the intriguing features of fractal images is self-similarity. If we zoom in on a fractal, we see the same pattern repeated again and again, sometimes with interesting variations. Here is a portion of the boundary of the Mandelbrot set, blown up to many times its original size. You can see the copy of whole set embedded in the image.
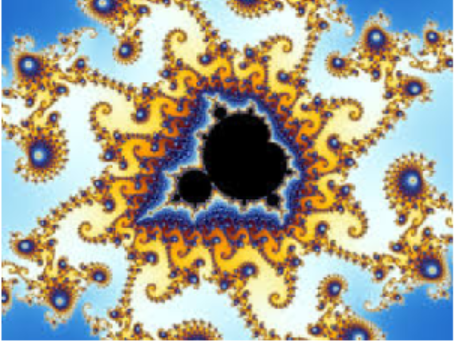
You can find a "Mandelbrot Zoomer" at
\begin{equation*}
\blert{\text{https://mathigon.org/world/Fractals}}
\end{equation*}
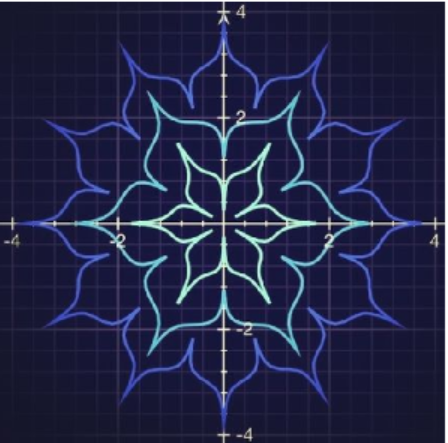
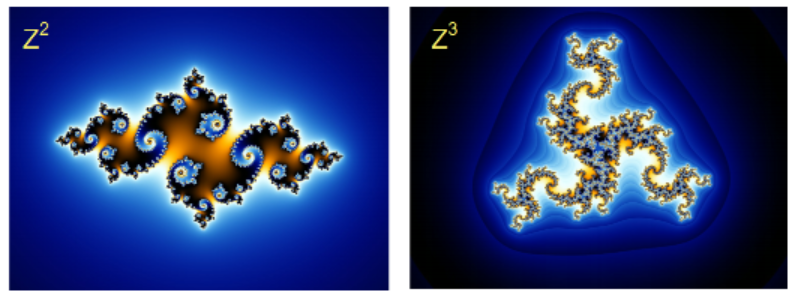
Here are some more fractals, called Julia sets:
Fractal patterns seem familiar because the laws that govern the creation of fractals are found throughout the natural world. Tree branches, rivers, ice crystals, and seashells all form in fractal shapes. You can see some examples at
\begin{equation*}
\begin{aligned}[t]
\blert{\text{https://www.mnn.com/earth-matters/wilderness-resources/blogs/}}\\
\blert{\text{14-amazing-fractals-found-in-nature}}\\
\end{aligned}
\end{equation*}
