We can graph equations in the variables \(x\) and \(y\text{.}\) The variable keys are located on the top row of the app 123 keyboard. There are two steps to graphing an equation:
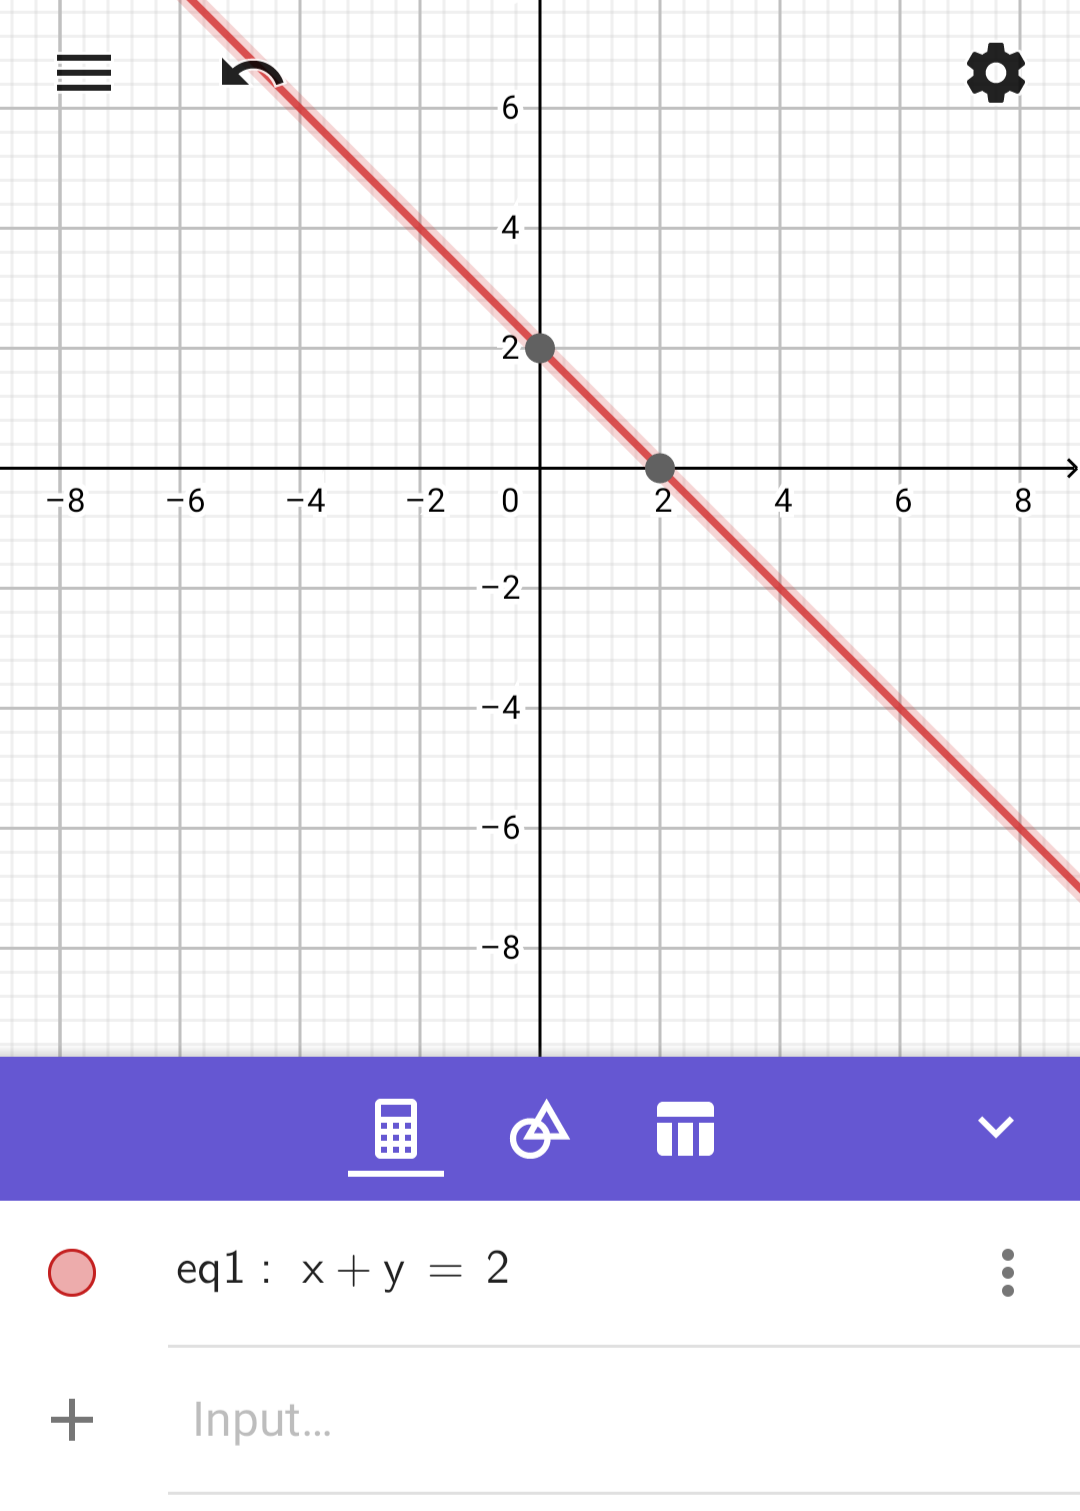
and the Graphics View shows the line passing through the points \((0,2)\) and \((2,0)\text{.}\) If we click on either of these two points, GeoGebra will show a label and the coordinates.
Special Points on a Graph.
GeoGebra automatically highlights "Special Points" with heavy dots on the graph of an equation. GeoGebra will show a label and the coordinates of any Special Point when we clicking on it.
In particular, any intercepts of a graph are Special Points.
The size and appearance of the displayed graph will vary with the display size and orientation of device we use. We can hide the Algebra View to increase the size of the Graphics View by clicking on the arrow key at the right edge of the border between the Algebra View and the Graphics View. Clicking again on the arrow key brings back the Algebra View.
SubsectionB.3.2Translate and Zoom
We can adjust "graphing window", called the "Graphics View" in GeoGebra, without entering numerical values.
ExampleB.3.2.
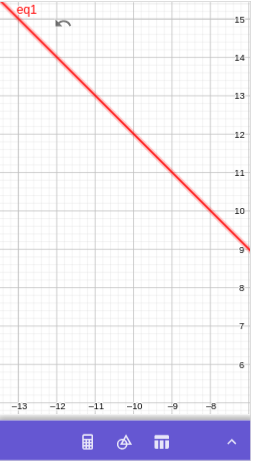
Continuing from Example 1, drag within the Graphics View so that you can see the point on the graph where \(y=15\text{.}\) Then zoom out until you can see both that point and the origin.
Solution: If we click on the arrow key at the right edge of the border between the Algebra View and the Graphics View, the Algebra View disappears to enlarge the Graphing View. But the point on the line where \(y=15\) is still not visible.
We can tap or click on the Graphics View and drag down and to the right until we can see the point \((-13,15)\text{.}\)
But the origin is no longer visible. We need to zoom out.
To Zoom out on a touch screen or touch pad, we "pinch in".
To Zoom using a mouse, click on the Graphics View, then hold the Shift key and rotate the mouse wheel forward.
NoteB.3.3.Retrieving the Algebra View.
To access the Algebra View again, click again on the arrow at the right edge of what had previously been the border between the Graphics View and Algebra View.
SubsectionB.3.3Graphing a Function, Making a Table, and Zooming One Axis
To graph an equation of the form \(y=(\text{expression in }x)\text{,}\) we only need enter the expression in \(x\text{.}\)
ExampleB.3.4.
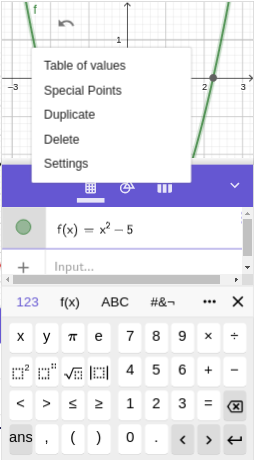
Graph the equation \(y=x^2-5\) for \(x\)-values between \(-5\) and \(5\text{.}\)
Clear the output history: In the Algebra View (see the Note above if the Algebra View is closed), tap the kebab menu icon (three vertical dots) in any existing history line, and select Delete. (If the menu does not apppear, you may wish to review the Note from the previous section.)
In the input box, enter \(x\text{,}\) then tap the squaring key, -\(5\)⮠.
The output history shows
\begin{equation*}
f(x)=x^2-5
\end{equation*}
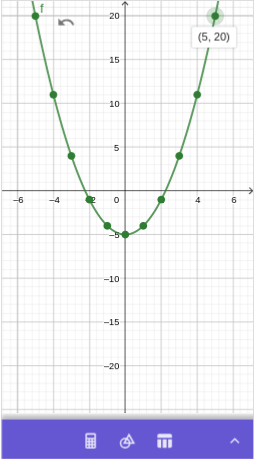
and the Graphics View shows the parabola.
Tap the kebab menu icon (three vertical dots) in the output history line, and select Table of values.
Set the Start value for \(x\) to \(-5\text{.}\) Set the End value for \(x\) to \(5\text{.}\) Set the Step value to \(1\text{,}\) then click OK
Click on the arrow key at the right edge of the border between the Algebra View and the Graphics View to hide the Algebra View and enlarge the Graphing View. Tap on any of the dark dots on the graph to see its coordinates.
We zoom out just enough so that both \(x=-6\) and \(x=6\) are both visible on the \(x\)-axis. Now we zoom out just the \(y\)-axis (until \(y=20\) is visible) as follows.
On a touch screen, we pinch vertically on the \(y\)-axis.
On a computer, we move the cursor above the \(y\)-axis until the cursor looks like a hand. Then holding down the Shift key, we click (the cursor changes again to an arrow pointing up to a horizontal segment), and drag down.
The points \((-5,0)\) and \((5,0)\) are now visible in the Graphics View.
We can also zoom on just the \(x\)-axis.
On a touch screen, we pinch horizontally on the \(x\)-axis.
On a computer, we move the cursor above the \(x\)-axis until the cursor looks like a hand. Then holding down the Shift key, we click (the cursor changes again to an arrow pointing right to a vertical segment), and drag left or right.