Sometimes the graph of an equation is not visible in the Standard view. The simplest way to modify the graphing window so that at least a part of the graph is visible is to use the Zoom fit option.
ExampleB.4.1.
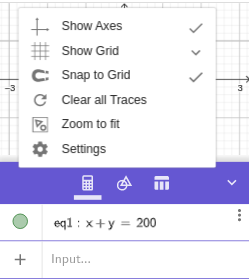
Graph the equation \(x+y=200\)
Clear out the output history of any previous graphs, then enter into the input box
\begin{equation*}
x + y = 200
\end{equation*}
The graph is not visible in the standard window, so we will try the Zoom fit command. Right-click on the Graphics View and choose Zoom to fit.
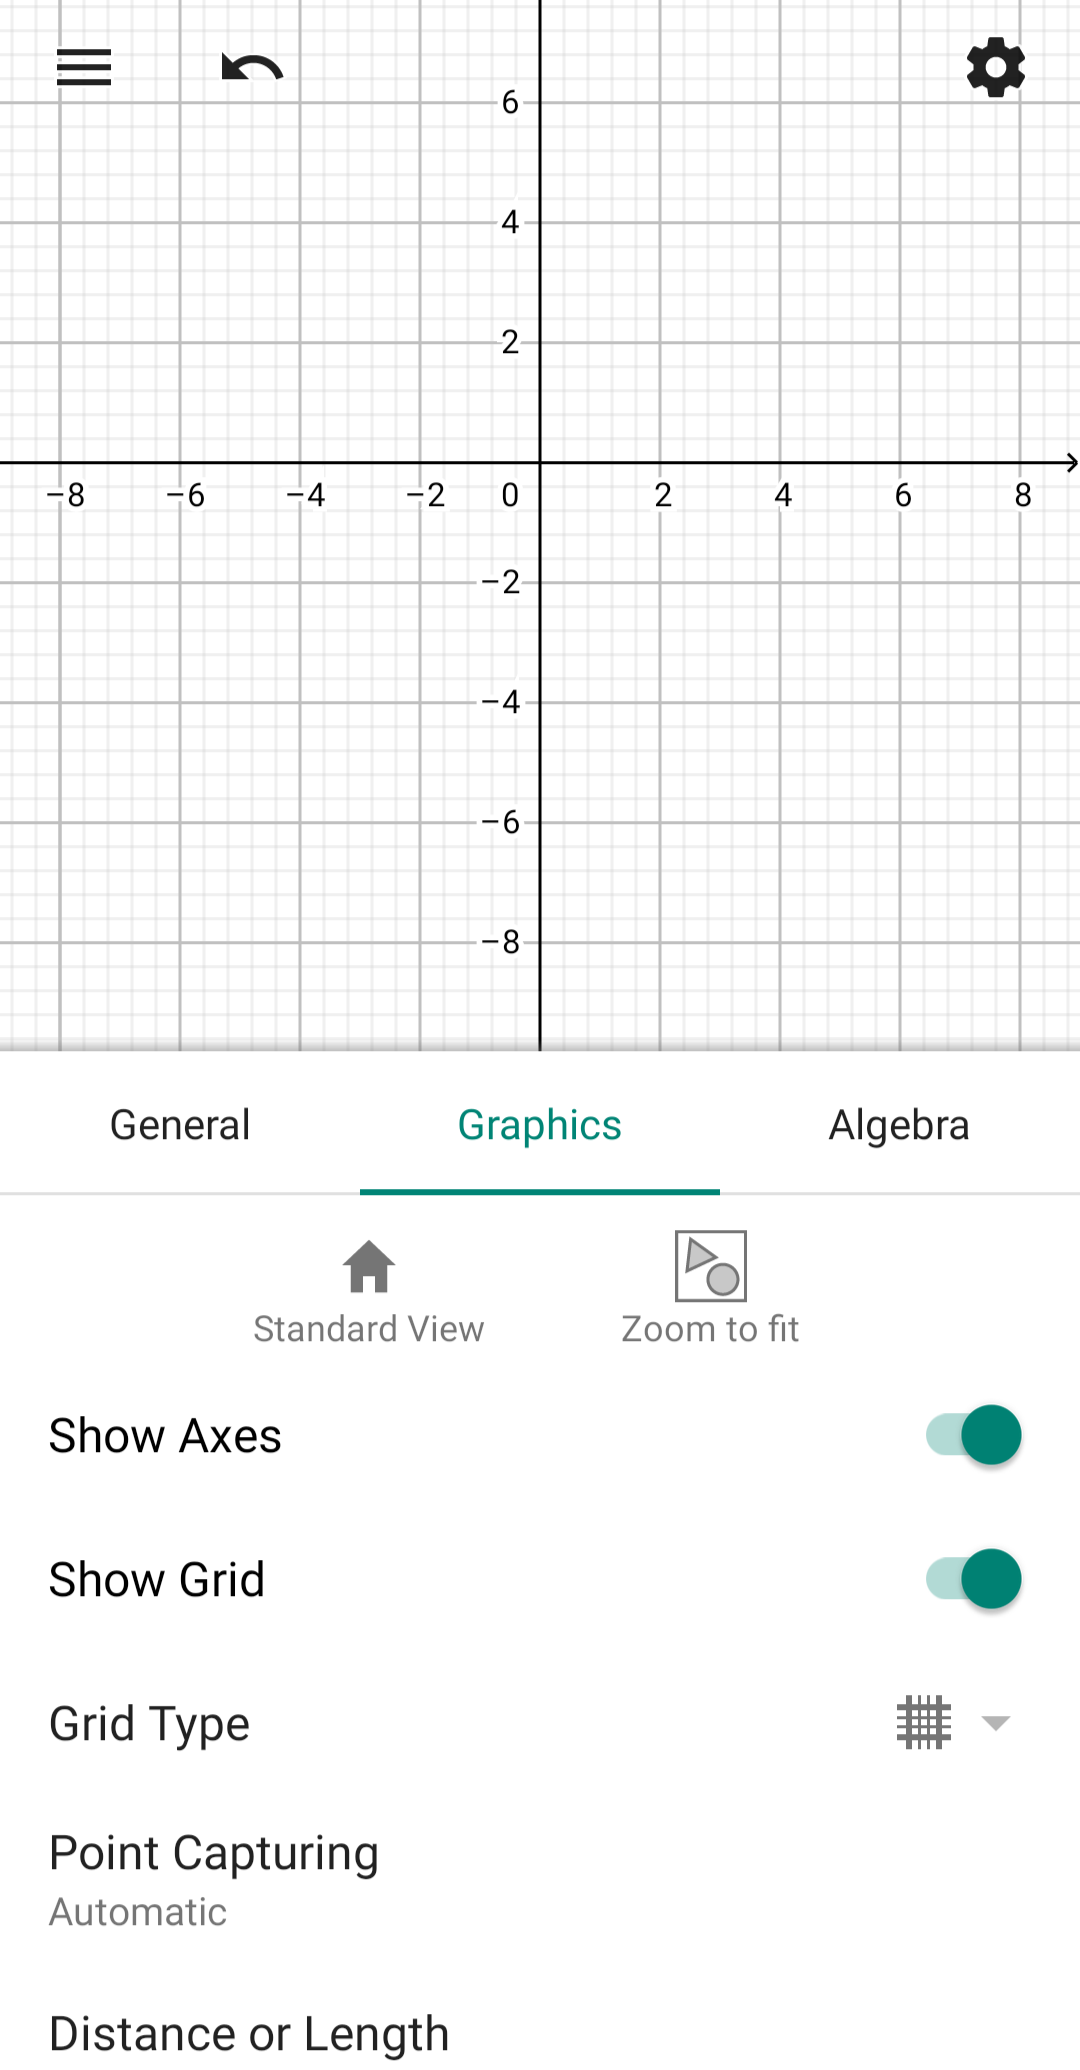
But if you use the GeoGebra calculator app on a mobile device, tap the options icon that resembles a gear, located in the upper right corner of the Graphics View, and a slightly different menu apears.
There are icons for both a Standard View and a Zoom to fit.
Once you can see part of the graph, you can further adjust the Graphics View by dragging and/or zooming.
SubsectionB.4.2Multiple Graphs and the Intersect Feature
We can display more than one graph at a time. We simply enter multiple equations, pressing ⮠ after each equation to put it into the calculator output history.
The points where two graphs meet are Special Points, and GeoGebra will give a label and coordinates when we click on an intersection point.
To turn off a graph without deleting its equation, we tap in the colored disk to the left of the equation in the output history. We tap the disk again to turn the graph back on.
ExampleB.4.2.
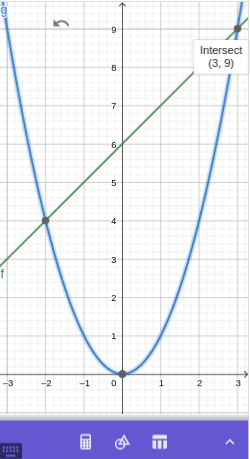
Find all the intersection points between the graphs of \(y=x+6\) and \(y=x^2\text{.}\)
We enter \(~ x +6 ~\)⮠ to graph the first equation, then \(~ x~\text{,}\) the squaring key, ⮠ to graph the second equation.
We can minimize the Algebra View and then click on each intersection point to see its coordinates. The two intersection points are \((-2,4)\) and \((3,9)\text{.}\)