Example B.5.2.
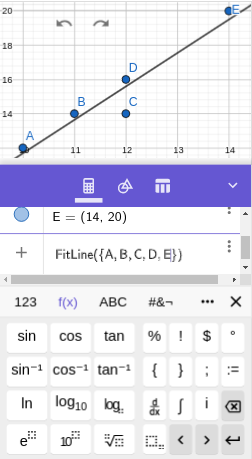
Make a scatterplot for the points \((10,12)\text{,}\) \((11,14)\text{,}\) \((12,14)\text{,}\) \((12,16)\text{,}\) \((14,20)\text{.}\) Then find the equation of the lease-squares regression line and plot it on top of the scatterplot.
We enter each of the five ordered pairs. The output history will show each labeled with a capital letter, such as \(A=(10,12)\text{.}\)
We do a Zoom to fit: right-click on the Graphics View (or click on the gear icon) and select Zoom to fit.
We next enter the FitLine command:
\begin{equation*}
\text{fitline}(\{A,B,C,D,E\})
\end{equation*}
using the ABC keyboard shown above for the letters, the 123 keyboard (keyboard image) for the parentheses, and the f(x) keyboard (keyboard image) for the list curly braces {}.
Important: We must enter capital letters for the names of the points--GeoGebra is case-sensitive regarding labels.