Section 5.2 Graphs of Functions
Subsection 1. New vocabulary
We can use function notation to describe a graph.
Fill in the blanks:
- The point \((a,b)\) lies on the graph of \(f\) if and only if .
- Each point on the graph of \(y=f(x)\) has coordinates .
- A graph of a function is increasing if the values get larger as we read from left to right.
- The maximum value of a function is the of the highest point on the graph.
Subsubsection Exercises
Checkpoint 5.6.
How do you know that the point \((1,9)\) lies on the graph of \(f(t)=-16t^2+20t+5\) ?
Because \(f(1)=9\text{.}\)
Checkpoint 5.7.
What are the coordinates of any point on the graph of \(h=f(t)\) ?
\((t, f(t))\)
Subsection 2. Solve equations and inequalities graphically
Subsubsection Examples
Every point on the graph of an equation \(y=f(x)\) tells us the solution of the equation for a particular value of \(y\text{.}\)
Example 5.8.
Use the graph of \(y=\dfrac{-2}{3}x-4\) to solve the equation
We see that \(y\) has been replaced by \(-2\) in the equation for the graph. So we look for the point on the graph that has \(y\)-coordinate \(-2\text{.}\)
This point, labeled \(P\) on the graph at right, has \(x\)-coordinate \(-3\text{.}\) Because it lies on the graph, the point \(P(-3,-2)\) is a solution of the equation \(y=\dfrac{-2}{3}x-4\text{.}\)
But this statement also tells us that \(-3\) is a solution of the equation \(\dfrac{-2}{3}x-4=2\text{.}\) You can check that substituting \(x=-3\) into this equation produces a true statement.
Example 5.9.
Use the graph of \(y=\dfrac{-2}{3}x-4\) to solve the inequality
We would like to find the \(x\)-coordinates of all points on the graph that have \(y\)-coordinate less than or equal to \(-2\text{.}\) These points on the graph are indicated by the heavy portion of the line.
The \(x\)-coordinates of these points are shown by the heavy portion of the \(x\)-axis. The solution is \(x \ge -3\text{,}\) or in interval notation, \([-3,\infty)\) .
Subsubsection Exercises
Checkpoint 5.10.
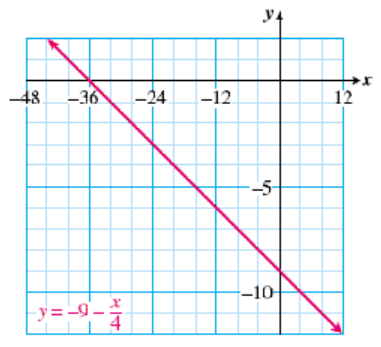
Use the graph to solve the equation or inequality. (Note the scales on the axes.) Show your solutions on the graph. Then verify your solutions by solving algebraically.
- \(\displaystyle -9-\dfrac{x}{4}=-2\)
- \(\displaystyle -9-\dfrac{x}{4} \ge -5\)

- \(\displaystyle x =-28\)
- \(\displaystyle x \le -16\)
Checkpoint 5.11.
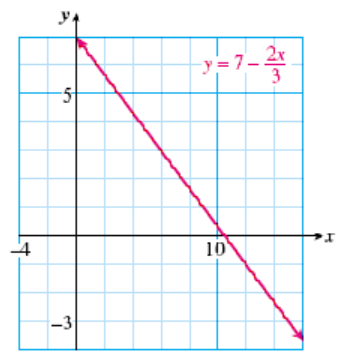
Use the graph to solve the equation or inequality. (Note the scales on the axes.) Show your solutions on the graph. Then verify your solutions by solving algebraically.
- \(\displaystyle 7-\dfrac{2x}{3}=3\)
- \(\displaystyle 7-\dfrac{2x}{3} \lt -1\)

- \(\displaystyle x =6\)
- \(\displaystyle x \gt 12\)
